Get started
BELUGA
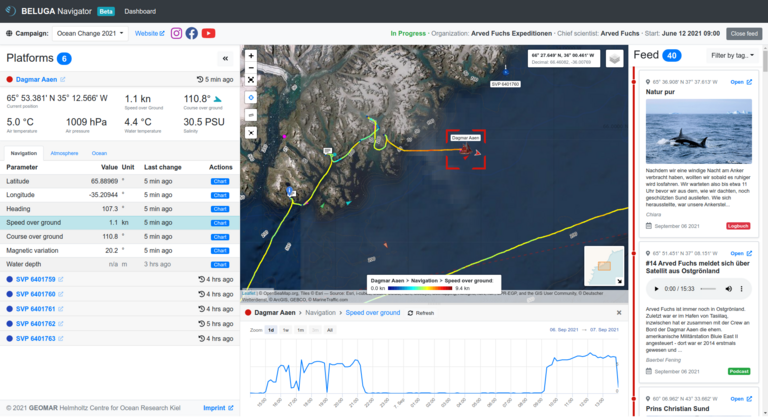
BELUGA is a system for displaying and monitoring platforms and sensor data during operations at sea in real time. Data can be displayed on board vessels and is available in an online interface in near real time. Communication with the platforms is also possible. Try it here: https://beluga.geomar.de
Description
The functionalities of BELUGA can be divided into the areas of "monitoring and control of platforms", "data visualization" and "outreach".
Monitoring and Control of Platforms
- Communication with platforms above and under water: By receiving and displaying status information or measured values, operations can be tracked and, if necessary, events can be reacted to (for example, by sending an emerge command).
- Automatic selection of the communication channel: When a message (for example, a command) is to be sent to a platform, BELUGA decides which medium (e.g., acoustic or WiFi) will be used to send the message.
- Display of platform positions on the map (situational awareness): The global positions of the integrated platforms are displayed in the map, which provides an overview in multi platform deployments. A measurement function in the map additionally allows to determine the distances between the platforms.
- Customized dashboards per platform type: Individual dashboards offer different options depending on the platform. This allows the display of specific information as well as a selection of actions adapted to the platform.
- Positioning: Using an Evologics USBL, the positions of integrated platforms can be determined from the base and sent to the platform (see Positioning).
Data Visualisation
- Real-time overview of received data on board: By displaying the platforms on the map and the transmitted measured values, an overview of the recorded data in the respective area is created.
- Display of data in charts: In addition to displaying the last transmitted data of a platform, each parameter can be displayed as a chart over time. Additionally, the track of the platform is colored in the map according to the legend of the parameter.
- Integration of external data into the map: Data can be integrated into the map as selectable overlays. In this way, for example, data created by models or recorded by satellites can be integrated into BELUGA. Examples are bathymetry or wind data.
- Data-Export: For fully integrated platforms, the downloading and processing of data can also be automated via BELUGA. In this procedure, the data is processed for storage according to standards and formats agreed with the data management. Part of the process is also to automatically generate a report of the exported mission if the necessary information has been maintained in the system.
Outreach
In addition to the system used on board during mission, there is a public version of the BELUGA Navigator that can be viewed online at: https://beluga.geomar.de
- Display of campaigns: Campaigns can be maintained for the onlie version only or, if running in BELUGA on board system, optionally be unlocked for the online version, too. Thus, campaigns can be followed online by scientists as well as other interested parties. The display is the same as in the ship system, except that online interaction with the platforms is not possible.
- Medien-Feed: In addition to the display of platforms and their data, a feed can be displayed in the online version of BELUGA, in which, for example, reports from on board or explanations of data are linked. The entries of the feed can be assigned to specific points on the map by specifying coordinates. The feeds for the campaigns are generated automatically, based on specified URLs (blogs, social media).

License
Not specified</>Source code
Not specified
Participating organisations
Related projects
DataHub
DataHub Initiative of the Research Field Earth and Environment
Updated 22 months ago