Contact person
SM
Ocean Data View (ODV) - Interactive exploration, analysis and visualization of oceanographic and other environmental data.
ODV is a software tool for the interactive exploration, analysis and visualization of oceanographic and other environmental data. ODV displays original data points or gridded fields based on the original data. ODV has two fast weighted-averaging gridding algorithms as well as the advanced DIVA gridding software built-in. Gridded fields can be color-shaded and/or contoured. ODV supports five different map projections and can be used to produce high quality cruise maps. High-resolution ODV visuals (see example below) can be exported as PostScript, gif, png, jpg, or GeoTIFF files.
The native ODV collection format provides dense storage and very fast data access, allowing creation and interactive exploration of large datasets with millions of stations on standard computers. Data from Argo, GTSPP, CCHDO, CORA, World Ocean Database, World Ocean Atlas, World Ocean Circulation Experiment (WOCE), SeaDataNet, and Medar/Medatlas can be imported easily. The ODV collection format has been adopted by international infrastructures like SeaDataNet, EMODnet, US SeaCube. Ready-to-use compilations of many important marine and other environmental datasets are available for download.
ODV also supports netCDF and lets you explore and visualize CF compliant netCDF datasets, either locally on your system or remotely with netCDF files served by an OPeNDAP server.
ODV has more than 10,000 active users worldwide, and ODV-created graphics are regularly published in a wide range of scientific journals. The Mentions section below lists the ODV citations in the prestigious journals Nature (ca. 360), Science (ca. 20), PNAS (ca. 20), AGU journals (ca. 600 in Paleoceanography and Paleoclimatology, Journal of Geophysical Research, Global Biochemical Cycles, Geophysical Research Letters, etc.), Springer journals (ca. 400 in Journal of Oceanography, International Journal of Environmental Science and Technology, Marine Biology, Scientific Reports, etc.) and more. Every month about 5-6 articles are published that include ODV graphics.
Citation: Schlitzer, Reiner, Ocean Data View, https://odv.awi.de, 2023.
webODV is the online version of ODV running in the browser without the need to install any additional software. webODV is perfectly suited to provide community datasets to serve always the newest versions and releases. In addition to the ODV-online, the nearly 1:1 ODV implementation, an intuitive data extraction service is available. Productive webODV instances are running at explore.webodv.awi.de, geotraces.webodv.awi.de, emodnet-chemistry.webodv.awi.de, webodv-egi-ace.cloud.ba.infn.it, mvre.webodv.cloud.awi.de and hifis.webodv.cloud.awi.de.
Citation: Mieruch-Schnülle, Sebastian and Reiner Schlitzer, https://doi.org/10.5281/zenodo.8241241, 2023.
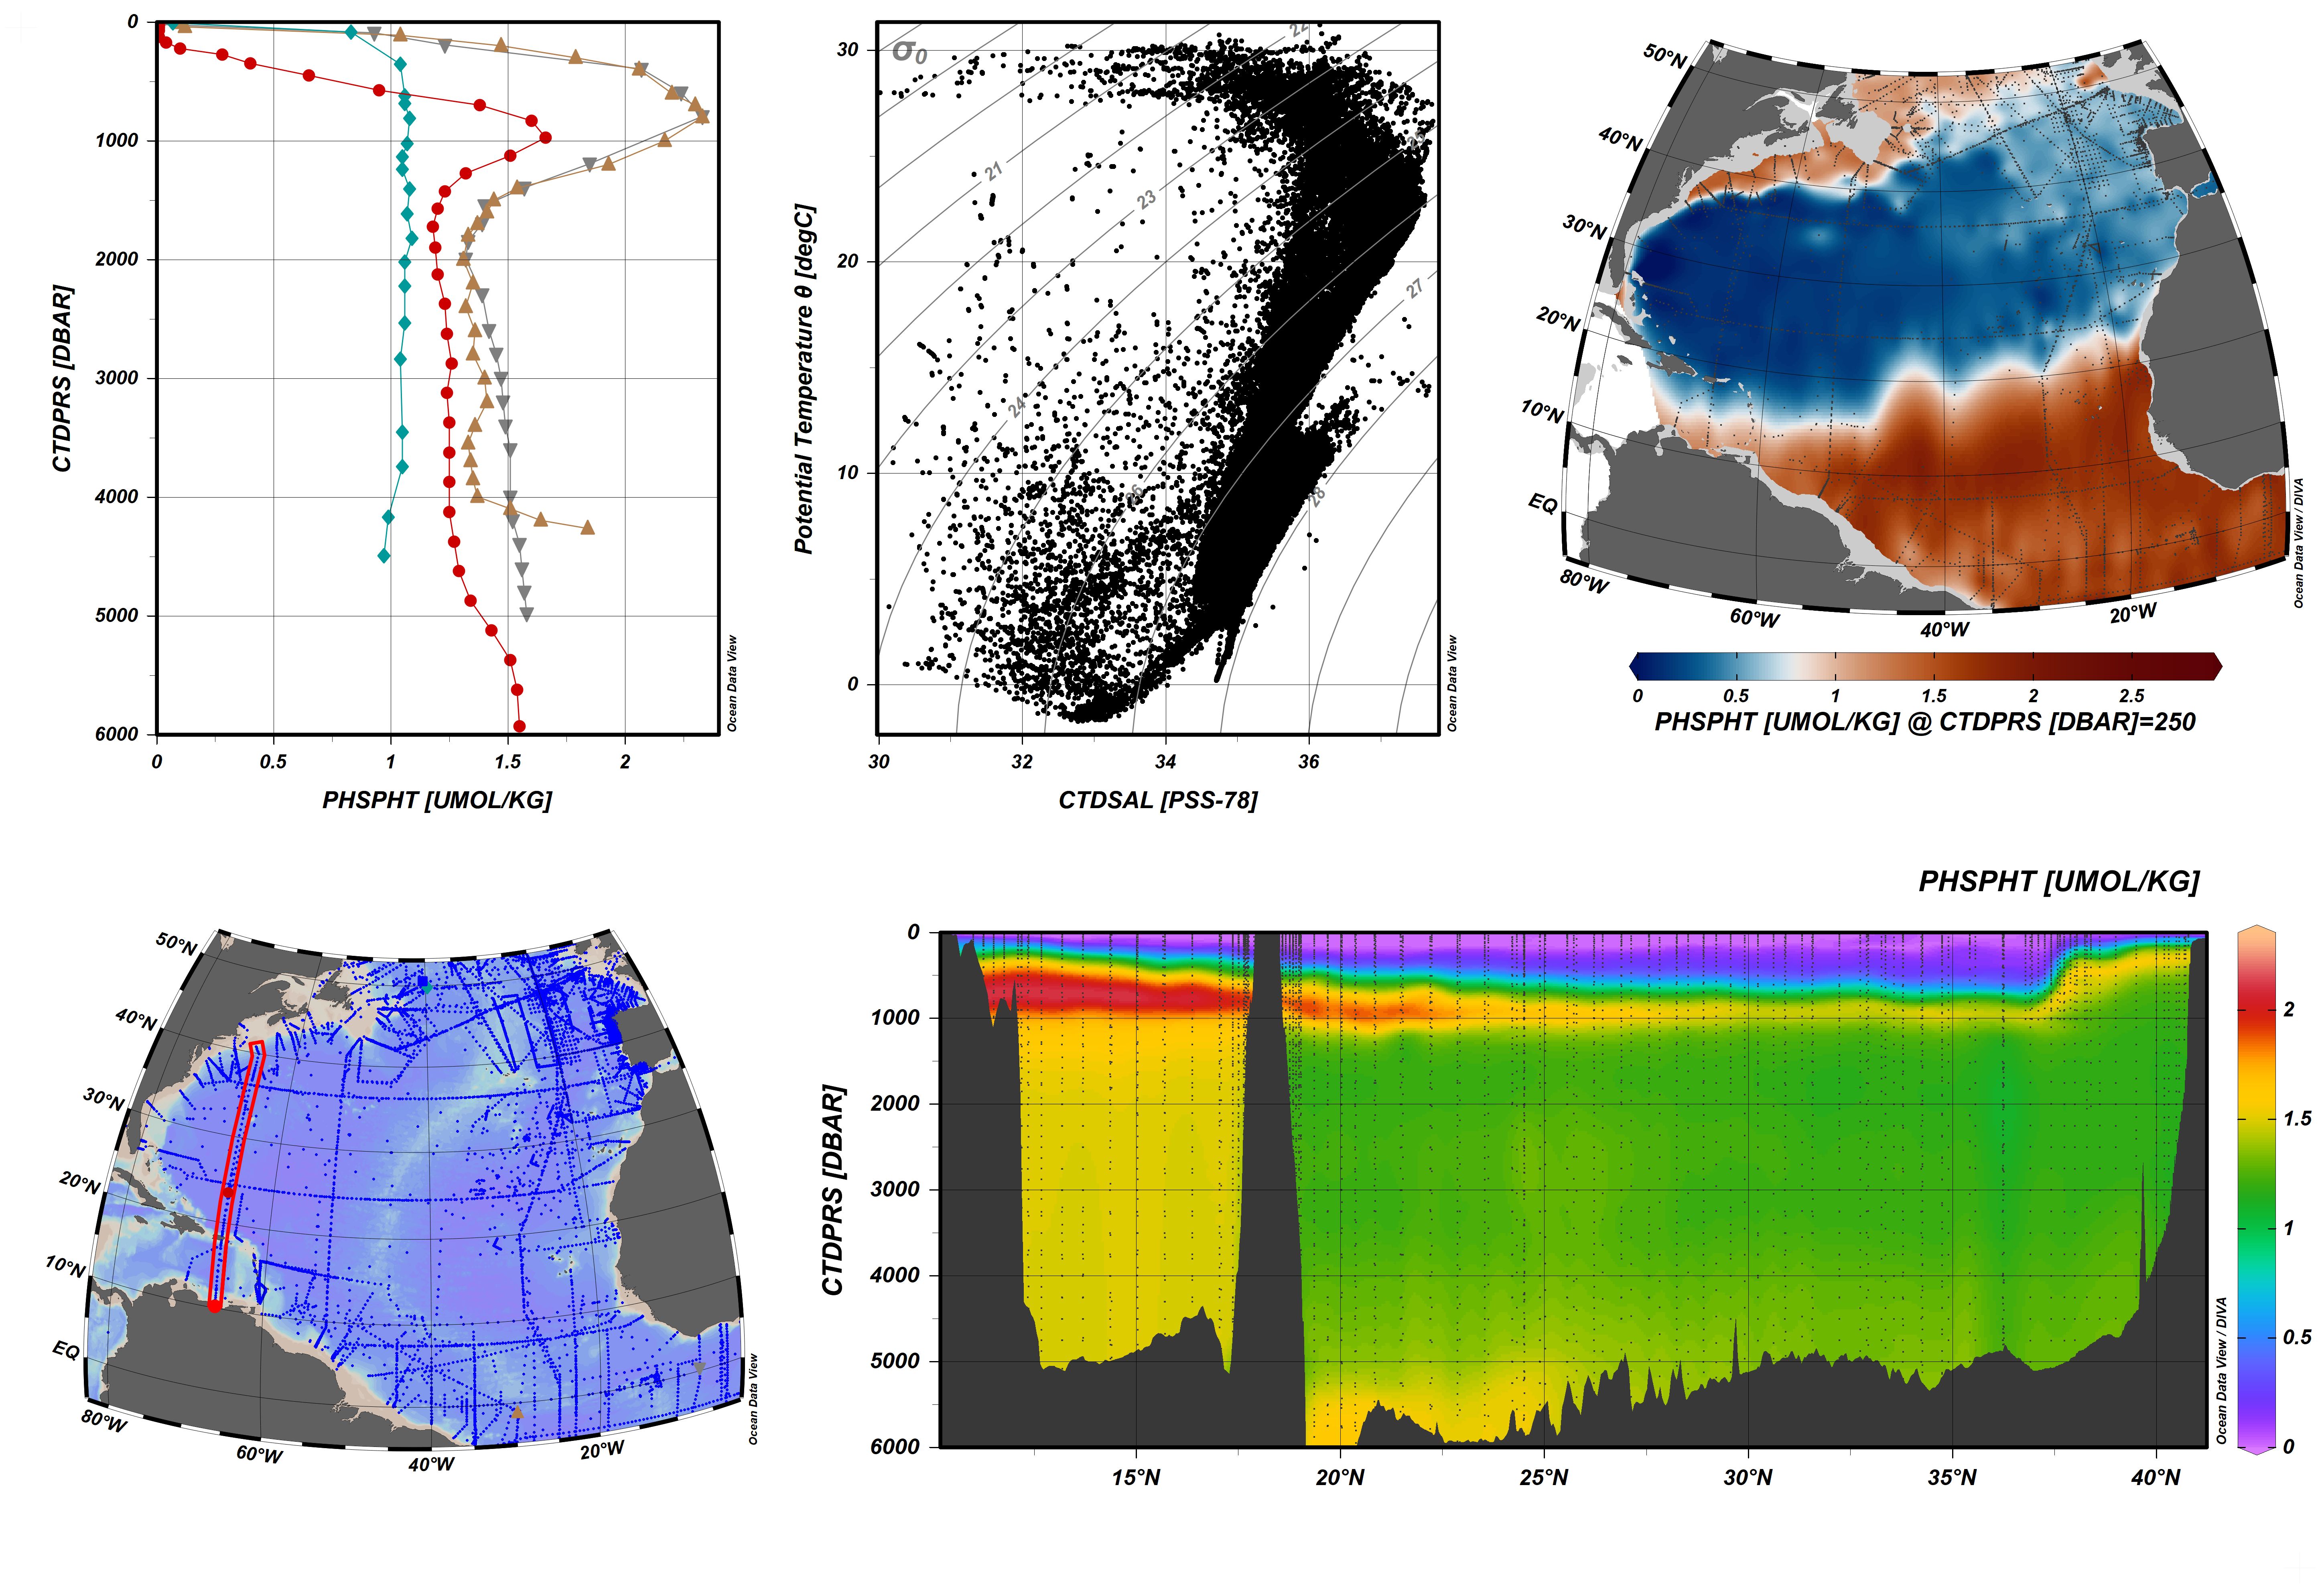 Example ODV canvas showing various window types.

DataHub Initiative of the Research Field Earth and Environment