The Cube Software Framework facilitates the collection, processing, and analysis of application performance profiling data from Score-P and Scalasca. With this framework, users have access to a comprehensive set of tools for measuring and understanding application performance.
Cube (CUBE Uniform Behavioral Encoding) is suitable for analyzing a wide variety of performance data for parallel programs including MPI and OpenMP applications.
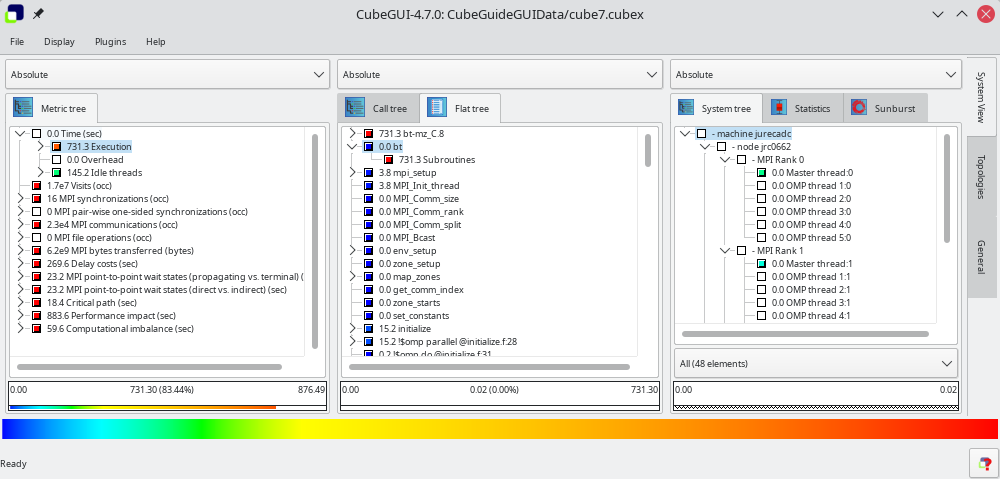
Cube has been designed around a high-level data model of program behavior called the cube performance space. The Cube performance space consists of three dimensions: a metric dimension, a program dimension, and a system dimension.
The metric dimension contains a set of metrics, such as communication time or cache misses. The program dimension contains the program's call-tree, which includes all the call paths onto which metric values can be mapped. The system dimension contains the components executing in parallel, which can be processes or threads depending on the parallel programming model. Each point of the space can be mapped onto a number representing the actual measurement for metric while the control flow of process/thread was executing call path. This mapping is called the severity of the performance space.
The display component CubeGUI can load such a file and display the different dimensions of the performance space using three coupled tree browsers. The browsers are connected in such a way that you can view one dimension with respect to another dimension.
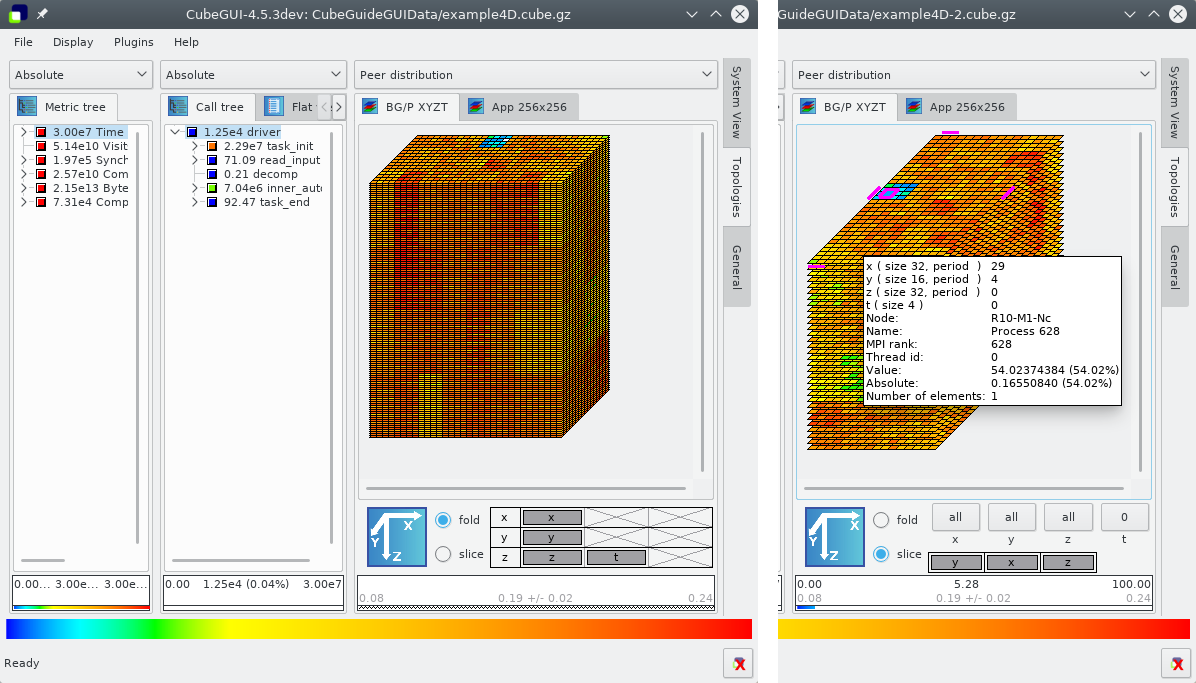
If the Cube file contains topological information, the distribution of the performance metric across the topology can be examined using the topology view. Furthermore, the display is augmented with a source-code display that shows the position of a call site in the source code.
Downloading CubeGUI
Please find the latest tarballs here:
https://perftools.pages.jsc.fz-juelich.de/cicd/cubegui/
Getting in contact
If you have any comments or questions regarding the use and installation of CubeGUI, or want to report a bug you discovered, please email scalasca@fz-juelich.de
Staying up-to-date
You can also sign up to the Scalasca News mailing list to receive the latest news about new releases, tutorials, workshops, and other Scalasca-related events.
Citing Cube
If you find CubeGUI helpful for your research, please mention it in your publications:
- Saviankou, P. (Corresponding author) ; Knobloch, M. ; Visser, A. ; Mohr, B.
Cube v4: From Performance Report Explorer to Performance Analysis Tool
International Conference On Computational Science, ICCS 2015, Reykjavík, Iceland, 1 Jun 2015 - 3 Jun 2015 Amsterdam [u.a.] : Elsevier, Procedia computer science 51, 1343 - 1352 (2015) http://dx.doi.org/10.1016/j.procs.2015.05.320
Acknowledgements
This work is supported by BMBF, DFG, Helmholtz POF, EU (FP7, Horizon 2020, ITEA-2), EuroHPC JU, US DOE, Siemens AG, Intel.
