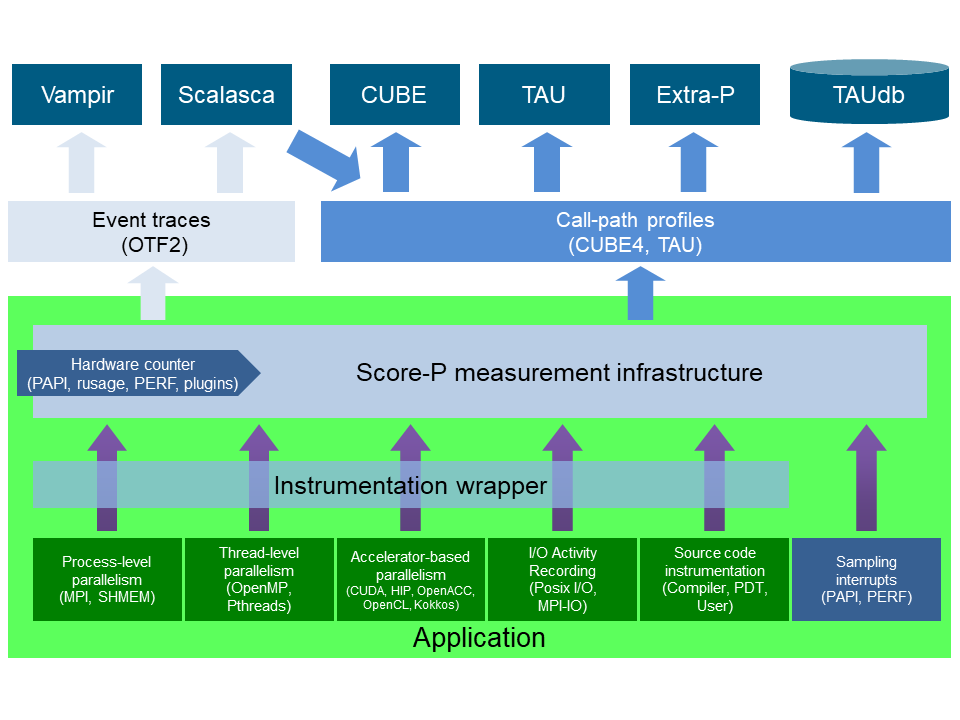
The Score-P instrumentation and measurement framework, together with analysis tools build on top of its output formats, provides insight into massively parallel HPC applications, their communication, synchronization, I/O, and scaling behavior to pinpoint performance bottlenecks and their causes. It is a highly scalable and easy-to-use tool suite for profiling (summarizing program execution) and event tracing (capturing events in chronological order) of HPC applications.
The scorep instrumentation command adds instrumentation hooks into a user's application by either prepending or replacing the compile and link commands. C, C++, Fortran, and Python codes as well as contemporary HPC programming models (MPI, threading, GPUs, I/O) are supported.
When running an instrumented application, measurement event data is provided by the instrumentation hooks to the measurement core. There, the events are augmented with high-accuracy timestamps and potentially hardware counters (a plugin-API allows querying additional metric sources). The augmented events are then passed to one or both of the built-in event consumers, profiling and tracing (a plugin-API allows creation of additional event consumers) which finally provide output in the formats CUBE4 and OTF2, respectively. These open and backwards-compatible output formats can be consumed by established analysis tools, e.g., like
- CubeGUI (RSD entry), the performance report explorer for Scalasca and Score-P, a generic tool for displaying a multidimensional performance space,
- Extra-P, an automatic performance-modelling tool that supports the user in the identification of scalability bugs,
- TAU's ParaProf, a portable, scalable performance analysis tool, and PerfExplorer, a framework for parallel performance data mining and knowledge discovery,
- Scalasca Trace Tools (RSD entry), a collection of trace-based performance analysis tools that have been specifically designed for use on large-scale systems featuring hundreds of thousands of CPU cores, automatically identifying potential communication and synchronization bottlenecks and offering guidance in exploring their causes, and
- Vampir, a trace-based framework that enables users to quickly display and analyze arbitrary program behavior.
The above can be summarized in this picture:
Even without the analysis tools, insights into a profiling experiment can be obtained by scorep-score, giving the user the opportunity to reconfigure a measurement, e.g., by filtering events that are of no value for an intended analysis. An instrumented application can be run in several configurations, just by setting Score-P environment variables. A list of configuration variables, recognized by a given Score-P installation, is available via the scorep-info command.
Early work on concepts for the first BMBF and DOE funded Score-P projects (starting 2009) originated from the Helmholtz University Young Investigators Grant and the Helmholtz Virtual Institute – High Productivity Supercomputing (both Felix Wolf).
The first Score-P release v1.0 was announced in 2011. From there on, Score-P is continually maintained and improved (using a meritocratic governance model), staying up-to-date with HPC trends.
Early on, the distributed development team invested in automated builds, tests, and deployment (CICD) from a source code repository to improve the portability of Score-P, a must-have in the non-standard HPC world. Nowadays, GitLab's CICD automation creates public ready-to-install stable and work-in-progress development tarballs, releases and documentation. It detects portability and coding convention issues early during review-based feature development.
Score-P grew into a major player in the tool's community and is attracting HPC vendors to fund implementation work to support their latest hardware.
Score-P is widely adopted at many HPC sites across the world and particularly documented its strength in several performance assessments during the EU H2020 POP CoE projects. Since more than a decade, its usage is taught at numerous VI-HPS Tuning Workshops, conference tutorials, and international HPC summer schools.
Accessing Score-P
Please find the latest ready-to-use tarballs here: https://perftools.pages.jsc.fz-juelich.de/cicd/scorep/
The public GitLab repository, a mirror of the development repository, is located here: https://gitlab.com/score-p/scorep
Getting in contact
If you have any comments or questions regarding the use and installation of Score-P, want to report a bug you discovered, or have a feature request, please email support@score-p.org or join us in the matrix room
#score-p-user-group:hpc.rwth-aachen.de.
Staying up-to-date
You can also sign up to the Score-P News mailing list to receive the latest news about releases, tutorials, workshops, and other Score-P-related events.
Citing Score-P
If you find Score-P helpful for your research, please mention the Score-P software DOI as well as the overview paper The Score-P performance tools ecosystem in your publications.
Acknowledgements
This work is supported by: