All software

VASCA
The VAriable Source Cluster Analysis (VASCA) is an astronomy pipeline for time-variable sources.
- Astronomy
- catalogue
- Data analysis
- + 6
- Jupyter Notebook
- Python

2x2, 3x3 and nxn Space-Filling Curves
Implementation of all possible forms of 2x2 and 3x3 space-filling curves, and nxn curves expanded from any specific level-1 units. It also implements the H-curve and the three-dimensional Hilbert curve.
- Data analysis
- Data Visualization
- open source
- R
- C++
- C
AIDA Experiment Analysis
AIDA Experiment Analysis provides tools for the analysis of data from experiments conducted in the AIDAc cloud simulation chamber. It helps researchers process, evaluate, and interpret experimental measurements.
- Aerosol Research
- AIDA
- Data analysis
- + 1
- Python

Anomx
Turn complex time-series data into actionable intelligence. Anomx combines AI agents, anomaly detection and predictive models to connect signals, investigate change and guide action. Built primarily for on-premises deployment, with hosted SaaS coming soon.
- AI agents
- anomaly detection
- Data analysis
- + 5
BELUGA
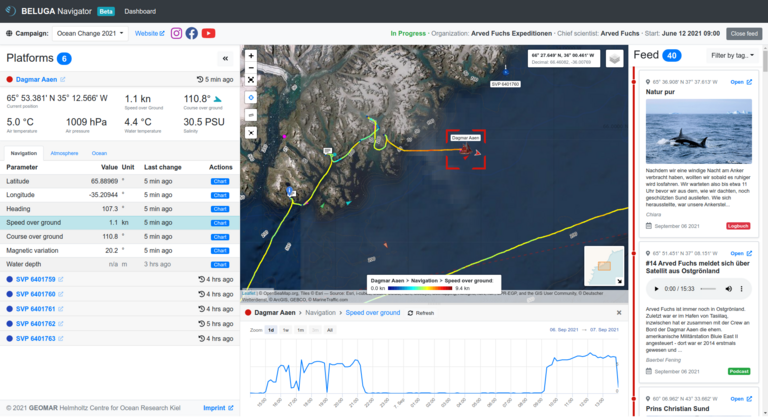
BELUGA is a system for displaying and monitoring platforms and sensor data during operations at sea in real time. Data can be displayed on board vessels and is available in an online interface in near real time. Communication with the platforms is also possible. Try it here: https://beluga.geomar.de
- Data Visualization
- Mission Planning
- Near Real-time
- + 1

Calopy
A web-based, open-source platform for the analysis of indirect calorimetry data, measuring energy metabolism in animals and humans.
- Data analysis
- Data Visualization
- Health
- + 2
- Python
- Dockerfile
- CSS

DataFlow
A comprehensive framework for automated data processing and manual postprocessing, including quality control and flagging. Modular and extensible design allows to create customizable pipelines and monitor their performance throughout the data lifecycle.
- data managment
- Data Visualization
- Pipeline
- + 2
- TSX
- Python
- TypeScript
- + 2

GR Framework
GR is a framework for cross-platform visualization applications for interactive plots or live displays of instruments. GR can easily be embedded in Qt applications or Jupyter notebooks. It can produce publication quality plots and provides interfaces for C, Julia, Python, Rust and JS.
- C++
- Data analysis
- Data Visualization
- + 3
- C
- C++
- CMake
- + 15

InteractiveVis
The InteractiveVis software framework provides a blueprint for evaluating 3D datasets with convolutional neural networks (CNNs), and for deriving and visualizing CNN relevance maps. This tool was developed and tested for disease detection in MRI scans. We plan to extend it to other domains.
- Data Visualization
- MRI
- open source
- + 1
- Jupyter Notebook
- HTML
- MATLAB
- + 5
iqtools
Collection of code for working with offline complex valued time series data in Python.
- Data analysis
- Data Visualization
- Particle Accelerators
- + 1
- Python

micromechanics-indentationGUI
Graphical User Interface (GUI) software for analyzing nanoindentation experimental data
- Data analysis
- Data Visualization
- Energy
- + 5
- Python

MooViE
MooViE is an easy-to-use tool to display multidimensional data with input-output semantics from all research domains. It supports researcher in studying the mapping of several inputs to several outputs in large multivariate data sets.
- C++
- Data Visualization
- C++
- CMake
- Dockerfile
- + 2