All software

BELUGA
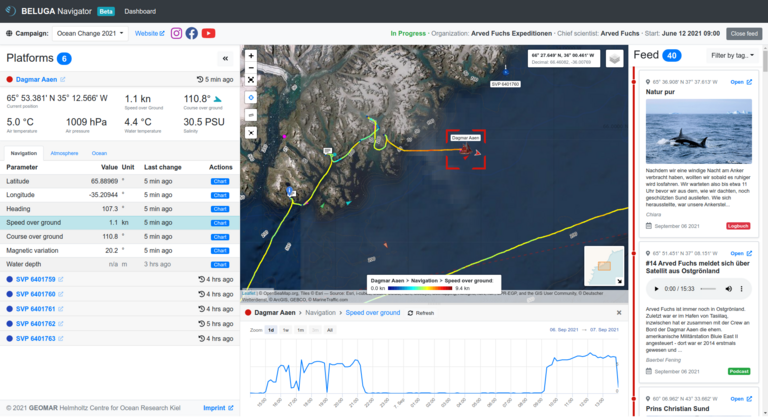
BELUGA is a system for displaying and monitoring platforms and sensor data during operations at sea in real time. Data can be displayed on board vessels and is available in an online interface in near real time. Communication with the platforms is also possible. Try it here: https://beluga.geomar.de
- Data Visualization
- Mission Planning
- Near Real-time
- + 1

GR Framework
GR is a framework for cross-platform visualization applications for interactive plots or live displays of instruments. GR can easily be embedded in Qt applications or Jupyter notebooks. It can produce publication quality plots and provides interfaces for C, Julia, Python, Rust and JS.
- C++
- Data analysis
- Data Visualization
- + 3
- C
- C++
- CMake
- + 15

InteractiveVis
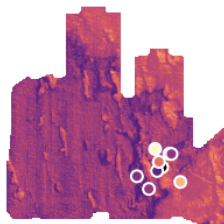
The InteractiveVis software framework provides a blueprint for evaluating 3D datasets with convolutional neural networks (CNNs), and for deriving and visualizing CNN relevance maps. This tool was developed and tested for disease detection in MRI scans. We plan to extend it to other domains.
- Data Visualization
- MRI
- open source
- + 1
- Jupyter Notebook
- HTML
- MATLAB
- + 5

iqtools
Collection of code for working with offline complex valued time series data in Python.
- Data analysis
- Data Visualization
- Particle Accelerators
- + 1
- Python

micromechanics-indentationGUI
Graphical User Interface (GUI) software for analyzing nanoindentation experimental data
- Data analysis
- Data Visualization
- Energy
- + 5
- Python

MooViE
MooViE is an easy-to-use tool to display multidimensional data with input-output semantics from all research domains. It supports researcher in studying the mapping of several inputs to several outputs in large multivariate data sets.
- C++
- Data Visualization
- C++
- CMake
- Dockerfile
- + 2
OSADCP Toolbox
Open-source Python toolbox called OSADCP for scientists to convert, clean, calibrate and organize binary raw vessel-mounted Acoustic Doppler Current Profiler (ADCP) data for scientific use. The toolbox is designed to process ADCP measurements in deep water by Teledyne RDI Ocean Surveyor ADCPs.
- Data Visualization
- Earth & Environment
- FAIR Data
- + 5
- Python

PyQuickMaps
A slim python library to link maps and sampling data with prediction methods. Needs scipy, numpy, matplotlib, pykrige, osgeo, rasterio.
- Data Visualization
- Earth & Environment
- Predictive Mapping
- + 1
- Python
Signal-Processor
Signal Processor in Python
- Butterworth Filter
- Data Visualization
- Filter Design
- + 7
- Python

Timeseries Management
The Timeseries Management allows to store, visualise, organise and share timeseries data and provides access to a (broad) selection of data from different long-term projects and campaigns (e.g. TERENO, MOSES).
- Data analysis
- Data Visualization
- Earth & Environment
- + 2
UTILE-Oxy
Automated workflow using deep learning for the analysis of videos containing oxygen bubbles in PEM electrolyzers: 1. preparing annotated dataset and training models to conduct semantic seg- mentation of bubbles and 2. automating the extraction of bubble properties for further distribution analysis.
- bubbles
- Data analysis
- Data Visualization
- + 7
- Python
- Jupyter Notebook