All software
PeCon.py
PeCon.py is a Python-Software, that enables the calculation of the ionic and electronic conductivities of Perovskite-type ceramic materials, i.e. the conductivities within oxygen-transport ceramic membranes.
- Energy
- MTET
- open source
- + 1

spiralize
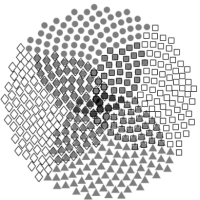
It visualizes data along an Archimedean spiral, makes so-called spiral graph or spiral chart. It has two major advantages for visualization: 1. It is able to visualize data with very long axis with high resolution. 2. It is efficient for time series data to reveal periodic patterns.
- Data analysis
- Data Science
- Data Visualization
- + 3
- R
- JavaScript
- CSS

CellDetection
An open-source Python package, offering advanced AI methods for the identification and segmentation of biomedical objects, such as cells, in image data. Includes trained models that work out-of-the-box for a wide range of use cases.
- cell counting
- cell detection
- cell segmentation
- + 9
- Python
- Dockerfile

Global Benchmark Database (GBD)
GBD is a comprehensive suite of tools for provisioning and sustainably maintaining benchmark instances and their metadata for empirical research on hard algorithmic problem classes.
- Data analysis
- FAIR Software
- Information
- + 4
- Python
- JavaScript
- HTML
- + 2
Ideal-Equilibrium-Oxygen-Membrane-Reactor
The Python script OMR_model.py allows to simulate oxygen membrane reactors with continuous gas flow rates.
- Energy
- Membrane reactor
- MTET
- + 3
- Python

JuPedSim
JuPedSim is a framework designed to support students and researchers in investigating pedestrian dynamics and conducting research related to the development and validation of new models or model features. It enables the analysis of experiments and facilitates the proper visualization of results.
- Information
- Modeling
- open source
- + 3
- Python
- C++
- Jupyter Notebook
- + 3

t8code
t8code (spoken as "tetcode") is a C/C++ library to manage parallel adaptive meshes with various element types. t8code uses a collection (a forest) of multiple connected adaptive space-trees in parallel and scales to at least one million MPI ranks and over 1 trillion mesh elements.
- data managment
- Data Visualization
- exascale
- + 3
- C++
- C
- CMake
- + 4

PtyLab.m/py/jl
A cross-platform, open-source inverse modeling toolbox for conventional and Fourier ptychography
- computational physics
- Data analysis
- Data Visualization
- + 10
- Jupyter Notebook
- Python

Prospective Monitoring and Management - App (PIA)
PIA is a free open-source eResearch System for monitoring of incident events and provides a digital infrastructure for conducting population-based studies in any research field - at a study centre or at home. PIA focuses on repeated surveys. #DigitalEpidemiology #LongitudinalDataCollection #FOSS
- Data Collection
- Digital Infrastructure
- epidemiology
- + 5
- TypeScript
- HTML
- JavaScript
- + 11

pkgndep
A new metric named 'dependency heaviness' is proposed that measures the number of additional dependency packages that a parent package brings to its child package and are unique to the dependency packages imported by all other parents.
- Data analysis
- Data Visualization
- FAIR Data
- + 3
- R
- HTML
- JavaScript
- + 1

simona
This package implements infrastructures for ontology analysis by offering efficient data structures, fast ontology traversal methods, and elegant visualizations. It provides a robust toolbox supporting over 70 methods for semantic similarity analysis.
- Data analysis
- Data Visualization
- FAIR Data
- + 3
- R
- C++
- JavaScript
- + 3

cyCONDOR
cyCONDOR, an easy-to-use computational framework for end-to-end High-Dimensional Cytometry data analysis. cyCONDOR offers guided pre-processing, clustering, dimensionality reduction, machine learning, pseudotime analysis, and batch integration, making it ideal for clinical and research settings.
- Data Visualization
- Health
- Machine learning
- + 2
- R