All software

PtyLab.m/py/jl
A cross-platform, open-source inverse modeling toolbox for conventional and Fourier ptychography
- computational physics
- Data analysis
- Data Visualization
- + 10
- Jupyter Notebook
- Python

pkgndep
A new metric named 'dependency heaviness' is proposed that measures the number of additional dependency packages that a parent package brings to its child package and are unique to the dependency packages imported by all other parents.
- Data analysis
- Data Visualization
- FAIR Data
- + 3
- R
- HTML
- JavaScript
- + 1

simona
This package implements infrastructures for ontology analysis by offering efficient data structures, fast ontology traversal methods, and elegant visualizations. It provides a robust toolbox supporting over 70 methods for semantic similarity analysis.
- Data analysis
- Data Visualization
- FAIR Data
- + 3
- R
- C++
- JavaScript
- + 3
AiiDA-Spirit
AiiDA plugin for FAIR high-throughput spin-dynamics simulations with the Spirit code (http://spirit-code.github.io/).
- data managment
- Data Visualization
- FAIR Data
- + 5
- JavaScript
- Python
- HTML
- + 1

cyCONDOR
cyCONDOR, an easy-to-use computational framework for end-to-end High-Dimensional Cytometry data analysis. cyCONDOR offers guided pre-processing, clustering, dimensionality reduction, machine learning, pseudotime analysis, and batch integration, making it ideal for clinical and research settings.
- Data Visualization
- Health
- Machine learning
- + 2
- R
stream2segment
A Python library and command line application to download, process and visualize event-based seismic waveform segments, specifically designed to manage big volumes of data
- Big data
- data managment
- Data Visualization
- + 5
- Python
- Jupyter Notebook
- HTML
- + 1

Digital Earth Viewer
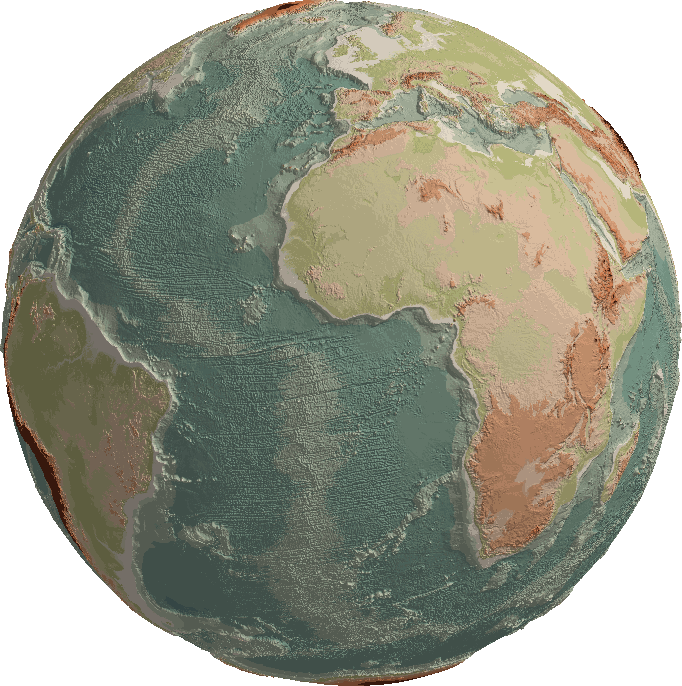
The Digital Earth Viewer is a tool for the visualisation and exploration of geospatial data in true 3D over time. It runs on Windows, MacOS and Linux and only requires a modern webbrowser to use. Common file formats such as CSV, netCDF, GeoTIFF and many more are natively supported.
- Data Visualization
- Earth & Environment
- Environmental Data
- + 1
- Rust
- JavaScript
- TypeScript
- + 2

GravIS
GravIS visualizes and describes Level-3 products based on the most recent GRACE and GRACE-FO data release from GFZ and the Combination Service for Time-Variable Gravity Fields (COST-G) of the International Gravity Field Service (IGFS).
- Data Visualization
- Earth & Environment

PeriHub
PeriHub is a platform that provides a numerical implementation of the peridynamic theory. It is an extension of the open source Peridigm software. Peridynamics is a non-local theory that overcomes discontinuity problems of the classical theory of continuum mechanics.
- Data Visualization
- High performance computing
- Modelling
- + 2
- Python
- Vue
- TypeScript
- + 7
Rankings Reloaded
Rankings Reloaded is an open-source toolkit for robust and accurate benchmark visualization and ranking. It is an out-of-the-box and open-source framework for analyzing and visualizing algorithm results in an accurate way. It uses challengeR and brings advantages of it with user-friendly interface.
- Data analysis
- Data Visualization
- Information
- + 1
- R

VASCA
The VAriable Source Cluster Analysis (VASCA) is an astronomy pipeline for time-variable sources.
- Astronomy
- catalogue
- Data analysis
- + 6
- Jupyter Notebook
- Python

2x2, 3x3 and nxn Space-Filling Curves
Implementation of all possible forms of 2x2 and 3x3 space-filling curves, and nxn curves expanded from any specific level-1 units. It also implements the H-curve and the three-dimensional Hilbert curve.
- Data analysis
- Data Visualization
- open source
- R
- C++
- C